Instead of concentrating on the “middle-income trap” idea, they should instead emphasize sustainable development based on enhancement of knowledge and human resources.
Although the Visegrad countries (V4) are continuously improving their economic indicators, there is an increased focus of attention on whether these good macro data are sufficient for achieving sustainability. Research findings highlight the danger of V4 countries becoming stuck in the so-called middle-income trap. Skóra (2017) explains the problem the following way: “The competitive advantage in the region has mostly been achieved through a cheap and qualified labor force, tax exemptions and more flexible labor rights. As a result, the economic strategy that makes the V4 countries attractive for business is simultaneously holding them hostage in the middle-income trap.”
The economic strategy that makes the V4 countries attractive for foreign business is simultaneously holding them hostage in a middle-income trap.1
Ehl (2016)1 warns that “the Central European policy of using cheap labor as an instrument of growth is reaching its limit.” Other authors talk about the slow convergence of the V4 countries to the income level of the high-income countries in the EU. Convergence is measured by GDP per capita (at PPP) as a percentage of the EU28 average.
Slow convergence is also explained as a sign of the middle-income trap. The term “middle-income trap” was originally coined by Gill and Kharas (2007)2 to refer to the marked slow-down seen in South-East Asia’s economic growth following the 1997–98 financial crisis. The term “middle-income trap” has recently been referred to as a slow-down in growth observed when an economy approaches the upper/middle-income level.
In accordance with Eichengreen et al. (2013),3 the middle-income trap means that after experiencing fast GDP growth and reaching middle-income status, economies follow a lower trajectory, which precludes them from “achieving high-income levels.
Society can only move forward as fast as it innovates. It can only provide lasting prosperity if it makes the most of the knowledge, entrepreneurial spirit and productivity of its people.2
It is apparent that the middle-income trap idea is basically concerned with convergence based on GDP growth as the most important indicator of economic success. In economies, however, where typically the lowest value-added phase of the global value chains of foreign business is located in order to capitalize on cheap labor even a higher GDP growth may not be enough to avoid middle-income trap. One reason is that a significant proportion of GDP can be repatriated.4
Competing based on low taxes and cheap labor does hinder, however, economic transformation to “highroad”, knowledge-based competitiveness, which needs considerable investments into human capital, innovation and entrepreneurship.
Rodrik’s (1999)5 warning that FDI6 brings no special benefits to host country development in comparison with other kinds of investment is very relevant in this context.
Growth, Convergence and Value Chains in the V4 in an International Perspective
Figure 1 illustrates what was said in the introduction. The average economic growth during the 2014-2018 time period was higher in the V4 countries than in Austria and Germany.

FIGURE 1: GDP growth average (2014-2018) and the convergence indicator in 2018. Source: Eurostat
In spite of the high growth numbers, convergence—measured by GDP per capita (at PPP) as a percentage of the EU28 average—has not been fast enough. The closest to the average is the Czech Republic with its 90 percentage value. This is still 37% lower than the Austrian value.
A basic reason can be found in Figure 2, which demonstrates the value chain positions of the V4 countries.
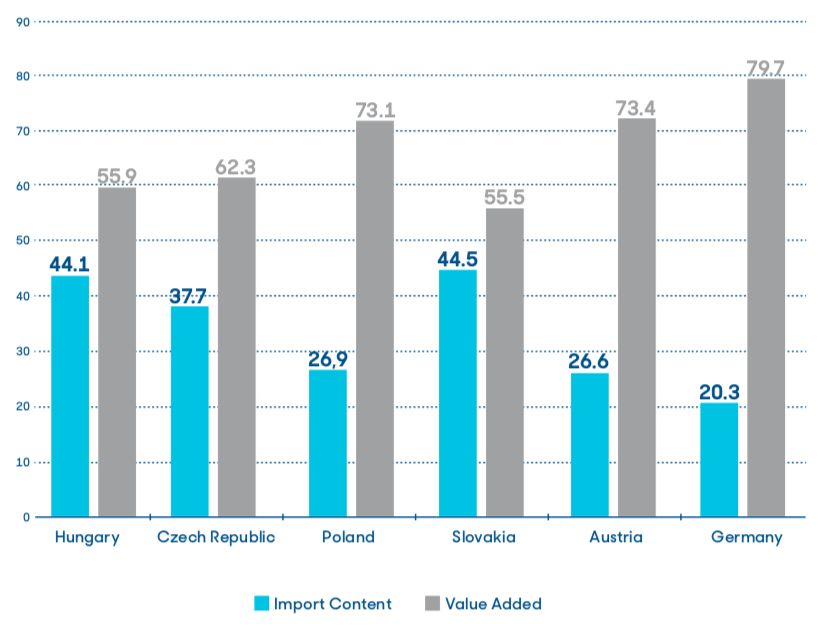
FIGURE 2: Import content of export and domestic value-added in gross export (2016, %). Source: OECD
While the locally added new value in export in 2016 was 79.7 percentage in Germany it was only 55.5 percentage in Slovakia. The import content of export, in contrast, is only 20.3 percentage in Germany, while it is 44.5 percentage in Slovakia. The low value-added in export correlates with the low value-added in manufacturing which constituted 31.7 percentage of the gross value added in 2017 in the Czech Republic, 26.6 percentage in Slovakia, 26.4 percentage in Hungary and 27.2 percentage in Poland (the EU average is 19.6%)7.
The V4 countries’ GDP growth is therefore heavily dependent on the local assembly line operations of foreign companies. This situation creates economic vulnerability. Because of this higher GDP, growth alone does not help the V4 countries move to a higher value-added economic structure. To avoid the middle-income trap, sufficient GDP has to be allocated to factors which contribute to developing knowledge-based economies. Among those factors the most important ones are government expenditure into R&D, education and health.
Competing based on low taxes and cheap labor does hinder, however, economic transformation to “high road”, knowledge-based competitiveness, which needs considerable investments into human capital.
How much is invested in R&D, education and health in the V4 countries in an international comparison?
R&D Innovation
General government expenditure in the V4 countries is about 40-47 per cent of the GDP on average. This expenditure could finance the modernization of the economic structure, and could also be spent on infrastructure development, or on strengthening the local SME sector.
Figure 3 illustrates the total government expenditure on economic affairs (Columns) along with government expenditure on R&D. The competitiveness rankings are also highlighted.
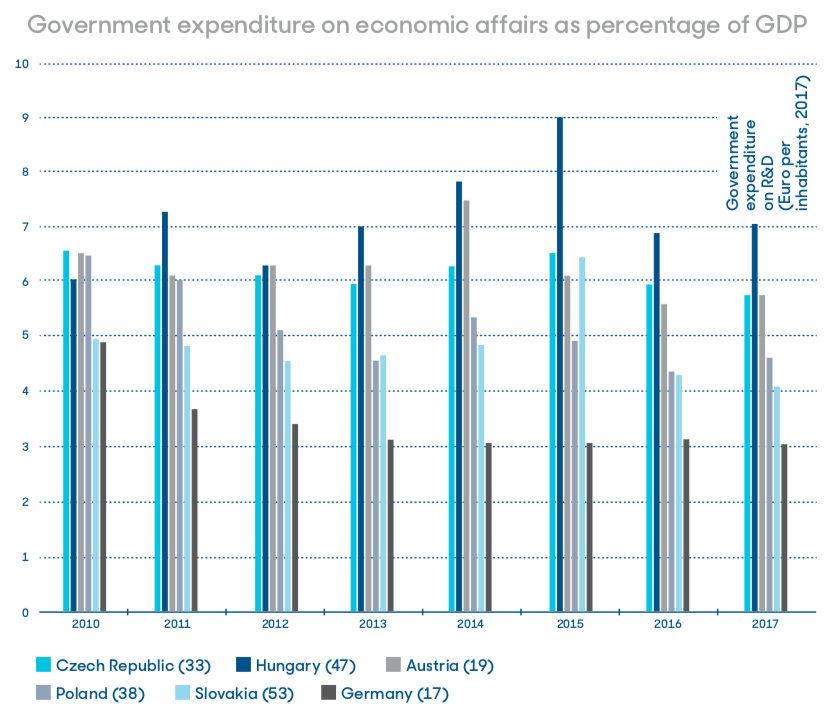
FIGURE 3: Total government expenditure on economic affairs as a percentage of GDP (2010–2017), on R&D (Euro per inhabitants) and competitiveness positions (IMD 2019). Source: Eurostat.
The following conclusions can be drawn from Figure 3:
— public/government money spent on strengthening the economy does not correlate with the competitiveness rankings. Hungary spends the most on it, for example, but it is still in the second-worst competitiveness position.
— the correlations are stronger between government expenditure on R&D and competitiveness rank.
— It is also important to note that the German and Austrian government spend a great deal more on R&D, which is obviously related to the higher local value added illustrated on Figure 2.
Innovation, as research findings prove, is especially important not only for supporting economic growth, but also for securing sustainable development, which also strengthens competitiveness.
The total R&D expenditure of all sectors (government and business) is illustrated in Figure 4 measured by Euro per inhabitants on the 2010—2017 time horizon. The numbers in brackets next to the country names demonstrate the position of the countries on the European Innovation Scoreboard list (2018).
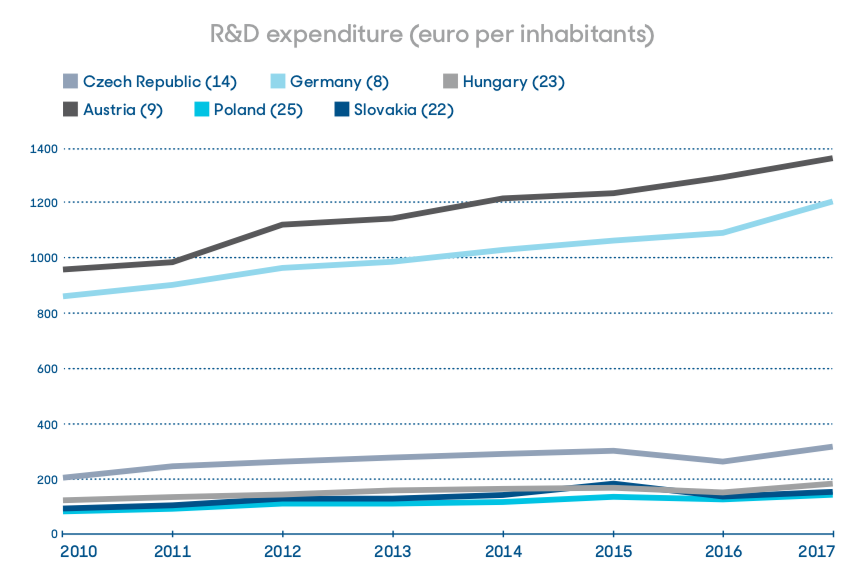
FIGURE 4: R&D expenditure (all sectors, Euro per inhabitants) and Innovation Scoreboard position (EU 2019. Source: Eurostat.
The Czech Republic has the best position (13) and Poland the worst one (25) on the EU innovation rankings from among the V4 countries.
As far as spending is concerned, Poland spends the least on R&D (including government & business spending). Austria and Germany spend the most, and they are the most innovative in the group of countries examined.
Adult education would be an absolute necessity for the V4 countries, especially because of the current dominance of assembly-line jobs. In accordance with OECD forecasts, these types of jobs will be robotized in the coming years.
Education
Education is also key for transforming economies into knowledge-based ones. Adult learning is especially important, as moving to a higher value-added economic structure needs the upgrading skills of the workforce, and as a matter of fact that of the entire population. This is especially important for acquiring new digital skills.
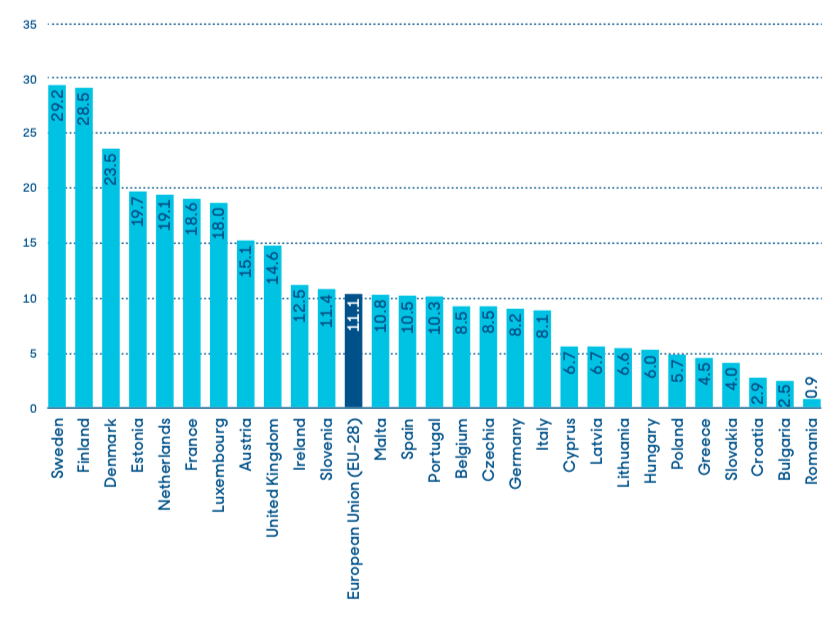
FIGURE 5: Adult participation in learning, 2018 (% of population aged 25–64). Source: Eurostat
The 2018 Eurostat data (Figure 5) indicate the problem of low-level participation in adult learning (% of the population aged 25–64)8 in the V4 countries compared to this ratio in the most competitive countries, such as Sweden (29.2%) Finland (28.5%) and Denmark (23.5%). Among the V4 countries, the data for the Czech Republic is the best (8.5%), but even this data is lower by 2.6% than the EU28 average (11.1%).
The lowest participation rate can be found in Slovakia (4.0%) which is the fourth-lowest rate in the EU. Adult education would be an absolute necessity for the V4 countries, especially because of the current dominance of assembly-line jobs. In accordance with OECD forecasts, these types of jobs will be robotized in the coming years, so employees will need new skills to remain employable. Digitalization will also require new knowledge throughout society. It is also worth mentioning that the V4 countries perform poorly on the Digital Economy and Society Index (DESI).9
The V4 countries’ GDP growth is therefore heavily dependent on the local assembly line operations of foreign companies. This situation creates economic vulnerability.
The DESI index measures relevant indicators on the digital performance of EU countries. Based on the composite indicator, the Czech Republic is in the 18 position, Slovakia the 21, Hungary the 23 and Poland the 25.
Two further important knowledge indicators are graduates in tertiary education and at the doctoral level in science, engineering, manufacturing and construction. The availability of this type of knowledge is crucial for a country for moving toward a knowledge-based economy, as these types of capabilities and skills are important for innovation and for modernizing the economic structure.
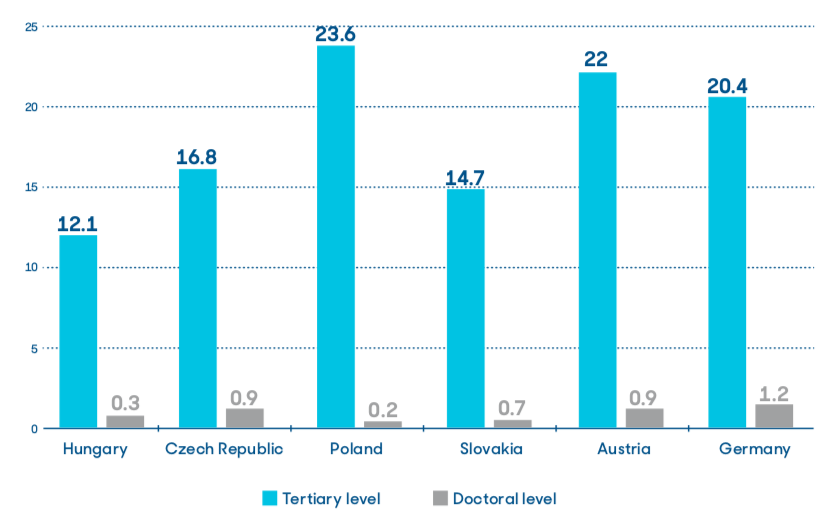
FIGURE 6: Graduates in tertiary education and at a doctoral level in science, engineering, manufacturing and construction per 1000 of population aged 20-29, and 25-34 (2017). Source. Eurostat
Figure 6 shows a backward position for these indicators in three of the V4 countries. Poland is doing well in terms of graduates, and the Czech Republic demonstrates good results for the doctoral level.
Finally, sustainability requires good health and a growing life expectancy and without it societal sustainability and a good quality labor force cannot be secured.
Potential years of life lost due to premature death is illustrated for several EU countries in the year 2016 in Figure 7. This is an OECD indicator which measures premature mortality, providing an explicit way of weighting deaths occurring at younger ages, which may be preventable. The calculation of Potential Years of Life Lost involves summing up deaths occurring at each age and multiplying this with the number of remaining years to live up to a selected age limit (age 70 used in OECD Health Statistics).

FIGURE 7: Potential years of life lost due to premature mortality in certain EU countries (2016). Government expenditure on health as an average percentage of GDP (2010–2016). Source: OECD
The dots inside the columns represent government expenditure on health as an average percentage of GDP for the 2010–2016 period.
Instead of focusing on the “middle-income trap” idea, they should instead emphasize sustainable development based on knowledge and human resources enhancement.
In accordance with the data, V4 countries are losing comparably more human resources due to premature death than the more developed countries of the EU.
It can also be observed that lower-level health expenditure seems to correlate with the larger lost years data in the case of Poland and Hungary. Health-care expenditure is not the only thing, however, which influences life expectancy. It is obviously one key influencer especially if a country, such as Hungary, systematically and continuously underfinances health-care.
Summary, conclusions
Other indicators could also be analyzed. Further research would be helpful to better outline the best and fastest ways for V4 countries to avoid the middle-income trap.
Based on the data and their relationships analyzed in this paper the following can already be concluded:
— GDP related indicators alone cannot explain objectively the success of convergence in the case of the V4 countries because of their strong reliance on foreign value chains
— GDP is not a good indicator for development, as it contains repatriated profit.
— Concentrating too much on GDP growth may actually “eat up” chances for further development.
— Convergence is not a good vision either: instead of a greater leap, a Schumpeterian “disruption” in economic policy is needed, which would help the V4 countries turn around, and stop competing on “cheapness”.
V4 countries need additional resources for managing change towards a knowledge-based economy based on innovation and improved human resources, which is only possible if they invest more in innovation and human capital.
They do not currently perform well in terms of innovation and human investment. Strong improvement is needed otherwise V4 countries will not be capable of moving to a more advanced position economically and socially. Instead of focusing on the “middle-income trap” idea, they should instead emphasize sustainable development based on knowledge and human resources enhancement. Better institutional governance and more effective and efficient spending of public money would also contribute positively to the transformation process.
Is it, therefore, the time to act with a long term view. J.F. Kennedy put it as follows: “The time to repair the roof is when the sun is shining.”
- Skóra, Maria: The V4 Lack of Shared Vision for Social Europe. EU Forum. 14 Nov. 2017.
- European Innovation Scoreboard 2018. European Union 2018.
- Ehl, M: Falling into the Middle Income Trap. Aspen Review. Issue 02/2016. Aspen Institute. Central Europe.
- Gill, I.S., Kharas, H. (2007): Successful Growth in Middle-Income Countries: Will East Asia Show the Way Again? Working Paper No. 121. April 2007 ECES.
- Eichengreen, B. Park, D.,and Shin (2013), “Growth Slowdowns Redux: New Evidence on the Middle-Income Trap.” NBER Working Paper, No. 18673.
- In the case of Hungary, in accordance with the Central Statistical Office data, 14% of the GDP leaves the country annually on average due to repatriation.
- Rodrik, D. (1999): The New Global Economy and Developing Countries: Making Openness Work. Washington: Johns Hopkins University Press for the Overseas Development Council.
- Foreign Direct Investment.
- Based on Eurostat data.
- The indicator measures the share of people aged 20 to 64 who stated that they had received formal or non-formal education and training in the four weeks preceding the survey.
- DESI 2019. EC


